In today’s data-driven digital world, business analysis is crucial for identifying problems and solutions. Business needs, user requirements, attributes, utility, and resource requirements are directly related to solutions. Three types of analytics are used: descriptive, predictive, and prescriptive. Business analysts analyze, understand, and improve processes for growth and success.
This guide explores the “20 Best Management Analysis Techniques” for effective decision-making and strategic planning in the ever-evolving business landscape. These techniques, ranging from quantitative methods to qualitative frameworks, provide valuable insights and inform strategies for sustainable growth. They address specific managerial challenges, optimizing operations, mitigating risks, and capitalizing on opportunities. Whether an executive or aspiring manager, this guide provides insights into these techniques, helping to elevate strategic thinking, inform decision-making processes, and lead organizations towards success in a competitive business landscape.
The Significance of Management Analysis Techniques
In the world of business, effective management analysis techniques serve as invaluable tools brimming with ideas, knowledge, and insights crucial for understanding and addressing the diverse needs and challenges faced by organizations. These techniques play a pivotal role in deciphering user requirements, identifying key aspects, assessing utility, and managing resource requirements, among other critical facets. They are indispensable for tackling the multifaceted problems that businesses encounter.
Navigating the Digital Age: A Plethora of Choices
In today’s rapidly evolving landscape, characterized by data-driven decision-making and the pervasive influence of the digital realm, there is an abundance of new opportunities and resources available to both consumers and enterprises. However, this abundance often leads to a paradox of choice, where individuals and businesses alike are overwhelmed by the sheer volume of options at their disposal.
The Perils of Choice Overload in Business
The overwhelming array of choices can, unfortunately, result in decision paralysis, causing people to hesitate or procrastinate when faced with numerous alternatives. While this phenomenon might be merely inconvenient for the average person, it can have dire consequences in the corporate sector, particularly when businesses are striving to formulate successful business strategies. In such cases, the ability to navigate this sea of choices effectively becomes paramount.
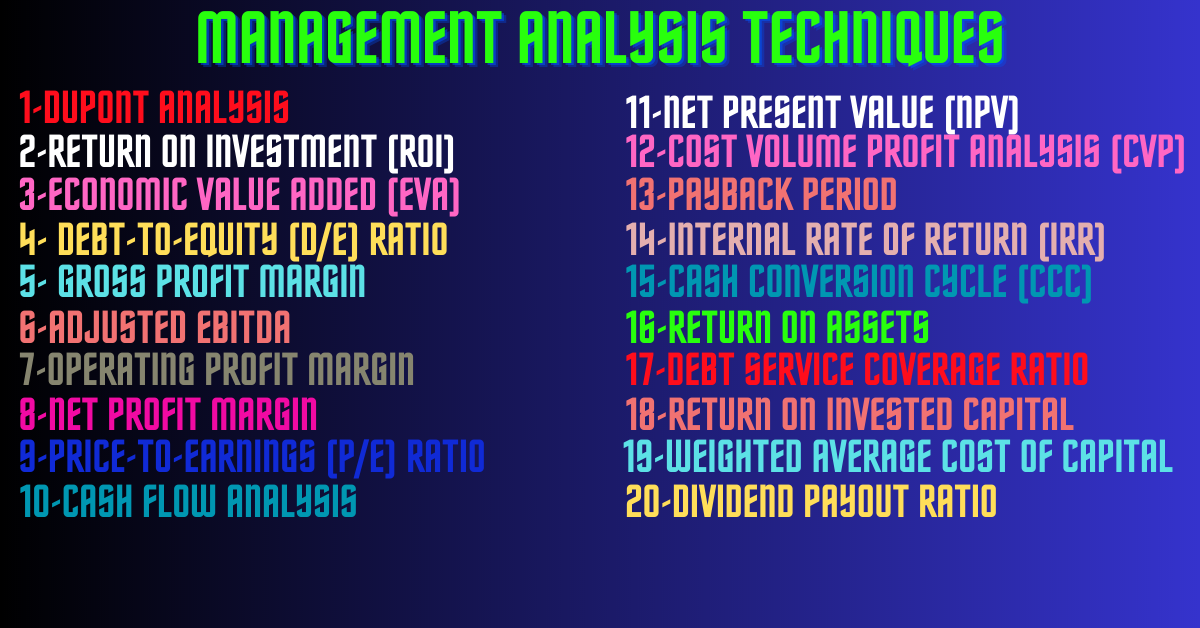
- 20 Best Management Analysis Techniques
- 1. Du Point Analysis
- 2. Return on Investment (ROI)
- 3. Economic Value Added (EVA)
- 4. Debt-to-Equity (D/E) Ratio
- 5. Gross Profit Margin (Management Analysis Techniques)
- 6. Earnings Before Interest, Taxes, Depreciation, and Amortization (EBITDA) and Adjusted EBITDA
- 7. Operating Profit Margin
- 8. Net Profit Margin
- 9. Price-to-Earnings (P/E) Ratio
- 10. Cash Flow Analysis (Management Analysis Techniques)
- 11. Net Present Value (NPV) (Management Analysis Techniques)
- 12. Cost Volume Profit Analysis (CVP) (Management Analysis Techniques)
- 13. Payback Period
- 14. Internal Rate of Return (IRR)
- 15. Cash Conversion Cycle (CCC)
- 16. Return on Assets (Management Analysis Techniques)
- 17. Debt Service Coverage Ratio (Management Analysis Techniques)
- 18. Return on Invested Capital (Management Analysis Techniques)
- 19. Weighted Average Cost of Capital (WACC)
- 20. Dividend Payout Ratio (Management Analysis Techniques)
- Disclaimers
20 Best Management Analysis Techniques
The followings are the 20 best management analysis techniques for business analysis:-
1. Du Point Analysis
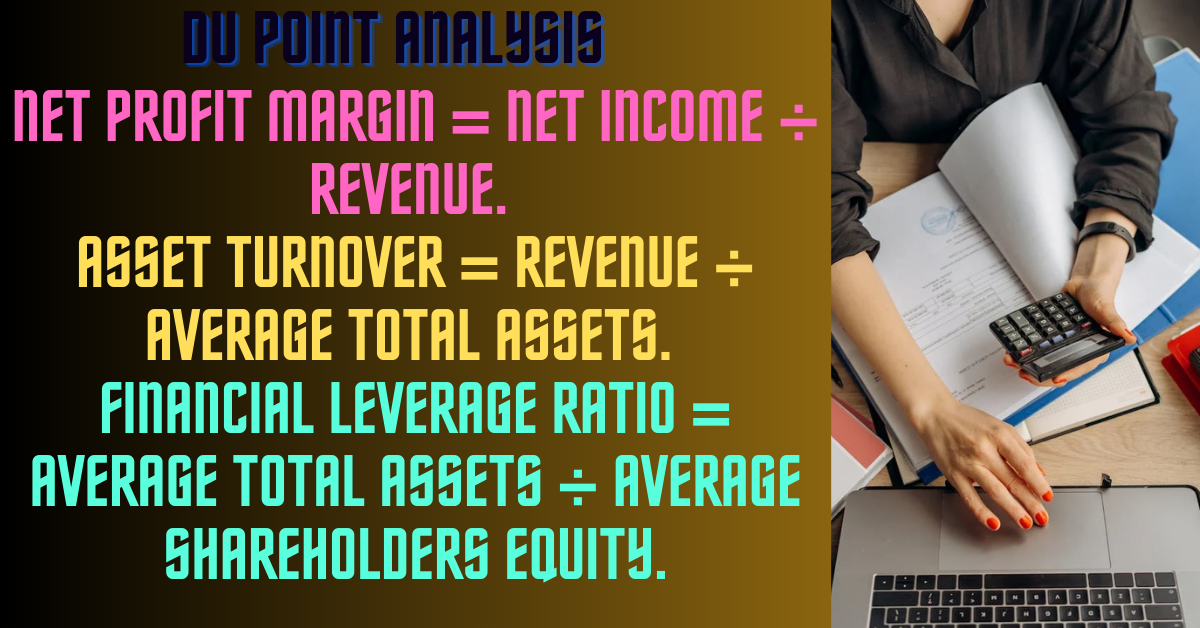
DuPont analysis is a tool for analyzing elementary performance originally popularized by the DuPont Corporation, now commonly used to compare the operational efficiency of two similar firms. DuPont analysis is a useful technique used to disintegrate the different drivers of return on equity (ROE).
A profitability analysis technique that breaks down your company’s return on equity (ROE) into three components: net profit margin, asset turnover, and financial leverage
Net Profit Margin = Net Income ÷ Revenue.
Asset Turnover = Revenue ÷ Average Total Assets.
Financial Leverage Ratio = Average Total Assets ÷ Average Shareholders Equity.
2. Return on Investment (ROI)

Return on investment (ROI) applies to the amount of money you earn that can be directly linked to an expense or series of expenses. For every investment, you should calculate a target ROI and track performance against it. There are various ways to measure ROI, depending on the type of analysis your firm chooses.
A measure of an investment’s profitability that determines your return as a percentage of your initial investment.
ROI = (Net After Tax Cash Flow from Investment – Cost of Investment) / Cost of Investment
3. Economic Value Added (EVA)
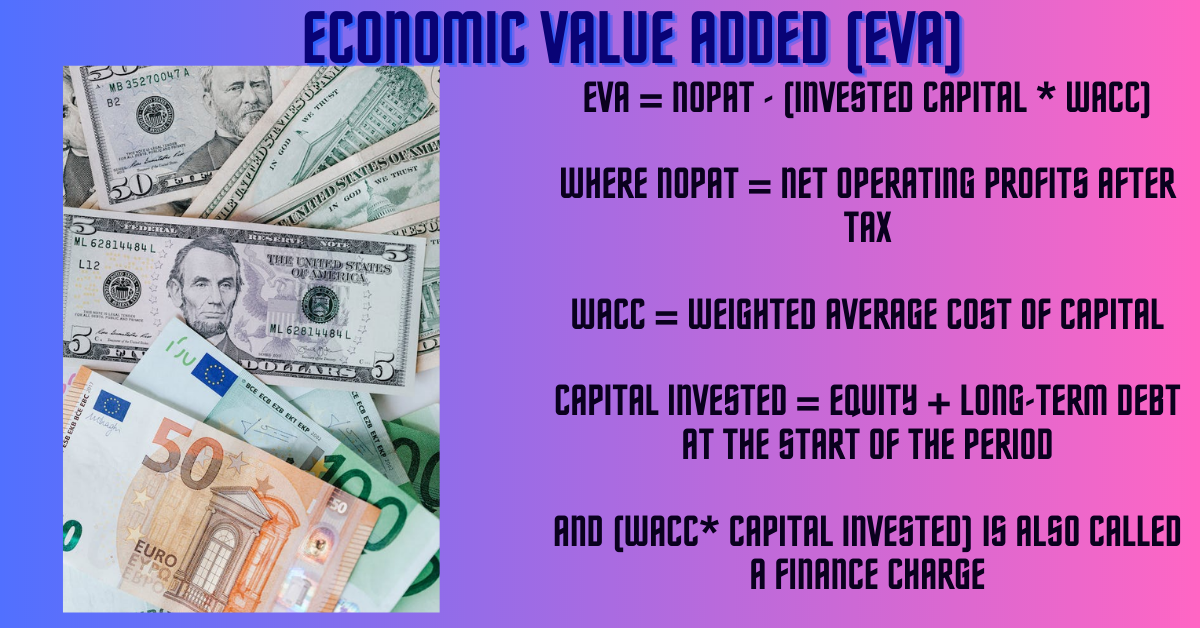
Economic Value Added (EVA) or Economic Profit is the incremental difference in the rate of return (RoR) over a company’s cost of capital. Or Economic Value Added (EVA) or Economic Profit is a measure established on the Residual Income technique that serves as a measure of the profitability of projects undertaken. Essentially, it is used to determine the value a company generates from funds invested in it. If a company’s EVA is negative, it shows the company is not producing value from the funds invested into the business. On the other hand, a positive EVA means a company is generating value from the funds invested in it.
The formula for calculating EVA is:
EVA = NOPAT – (Invested Capital * WACC)
Where NOPAT = Net Operating Profits After Tax
WACC = Weighted Average Cost of Capital
Capital invested = Equity + long-term debt at the start of the period
and (WACC* capital invested) is also called a finance charge
4. Debt-to-Equity (D/E) Ratio

The debt-to-equity ratio (D/E ratio) presents how much debt a company has compared to its assets or a company’s total liabilities with its shareholder equity. It is calculated by dividing a company’s total debt by total shareholder equity. A higher D/E ratio shows the firm may have a harder time covering its liabilities.
D/E Ratio Formula and Calculation
Debt/Equity=Total Liabilities/Total Shareholders’ Equity
5. Gross Profit Margin (Management Analysis Techniques)

A gross profit margin is a tool used to determine a company’s financial health by calculating the amount of money left over from product sales after deducting the cost of goods sold (COGS). Sometimes referred to as the gross margin ratio, the gross profit margin is frequently stated as a percentage of sales.
The Formula for Gross Profit Margin
Gross Profit Margin=Total Net Sales − COGS/ Total Net Sales
The gross profit margin varies from industry to industry, though, service-based industries tend to have higher gross margins and gross profit margins as they have small amounts of cost of goods sale (COGS). On the other hand, the gross profit margin for manufacturing companies will be lower because they have more COGS.
6. Earnings Before Interest, Taxes, Depreciation, and Amortization (EBITDA) and Adjusted EBITDA

Earnings Before Interest, Taxes, Depreciation, and Amortization, or EBITDA is a financial benchmark. Companies use it broadly to calculate their business performance in terms of finances and are also often used as an alternative to net income.
Moreover, it provides a distinct idea to investors and lenders regarding the profitability of a company. However, EBITDA is often assumed to be false as it does not reflect the cash flow of the company.
EBITDA Calculation
Subtracting a firm’s expenses other than interest, taxes, depreciation, and amortization from its net income.
If you are looking for an answer to how to determine EBITDA, typically, there are two formulas that can be used for the same.
EBITDA=Net profit + Interest + Taxes + Depreciation + Amortization or
EBITDA= Operating Profit + Depreciation + Amortization
Adjusted EBITDA is a financial metric for clear insight into a company’s financial state and valuation. This is a type of EBITDA that doesn’t consider irregular items.
7. Operating Profit Margin

Operating Profit Margin is a performance or profitability ratio that shows the percentage of profit a company generates from its operations before deducting taxes and interest charges. It is determined by dividing the operating profit by total sales and expressing it as a percentage.
The formula of Operating Profit Margin
Operating Profit Margin= Operating Profit * 100/ Total sales
8. Net Profit Margin

The net profit margin, or simply net profit, is a financial ratio used to determine how much net income or profit is produced as a percentage of revenue. It is the ratio of net profits to revenues for a firm or business segment. It is typically expressed as a percentage but can also be represented in decimal form.
Net Profit Margin= R−COGS−E−I−T*100/R
=Net Income*100/R
Where-
R-Revenue
COGS- Cost of Goods Sales
E- Operating and other expenses
I- Interest
T- Taxes
9. Price-to-Earnings (P/E) Ratio

The Price Earnings Ratio (P/E Ratio) is the relationship between a firm’s stock price and earnings per share (EPS). It is a famous ratio that provides investors with a better sense of the value of the firm. The P/E ratio reflects the prospects of the market and is the price people must pay per unit of current earnings (or future profits, as the case may be).
P/E Ratio= current stock price / Earning Per Share
Earnings are vital when valuing a firm’s stock as investors wish to know how profitable a firm is and how profitable it will be in the future. Moreover, if the firm doesn’t expand and the current level of earnings remains constant, the P/E can be interpreted as the number of years it will take for the firm to pay back the amount paid for each share.
10. Cash Flow Analysis (Management Analysis Techniques)

Cash flow is the amount of cash and cash equivalents, like securities, that a business produces or spends over a fixed time period. The cash on hand calculates a firm’s runway—the more cash on hand and the lower the cash burn rate, the more space a business has to excel and, normally, the higher its valuation.
It varies from profit. Cash flow mentions to the money that flows in and out of your business. Earning, however, is the money you have after subtracting your business expenses from total revenue.
What Is Cash Flow Analysis?
There are three cash flow types that companies should monitor and analyze to calculate the liquidity and solvency of the business: these are cash flow from operating activities, cash flow from financing activities, and cash flow from investing activities. All three are shown on a company’s cash flow statement.
In overseeing a cash flow analysis, businesses interact with line items in those three cash flow categories to know where money is coming in, and where it’s going out. From this, they can reach conclusions about the current state of the business.
Depending on the kind of cash flow, bringing in funds isn’t necessarily a good thing. And, spending money isn’t inevitably a bad thing.
- Cash from operating activities shows cash received from customers minus the amount spent on operating expenses. In this bucket are annual, recurring expenses such as wages, utilities, supplies, and rent.
- Investing activities show funds spent on fixed assets and financial instruments. These are long-term, or capital investments, such as investments in property, assets in a plant, or the purchase of stock or securities of another firm.
- Financing cash flow is funding that comes from a company’s promotors, investors, and creditors. It is described as debt, equity, and dividend transactions on the cash flow statement.
11. Net Present Value (NPV) (Management Analysis Techniques)
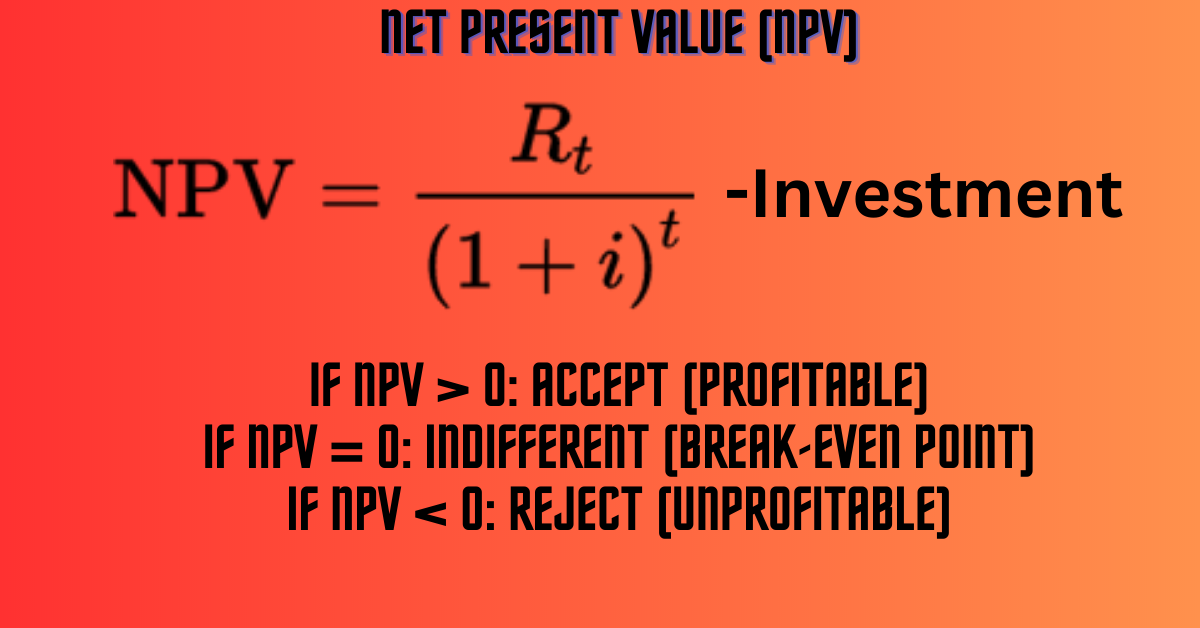
Net present value (NPV) refers to the difference between the present value of cash inflows and the present value of cash outflows over a period of time. NPV is generally used in capital budgeting and investment planning to analyze the profitability of a forecasted investment or project.
NPV is the outcome of calculations that find the present value of a future inflow of payments, using the proper discount rate. In general, projects with a positive NPV should consider while those with a negative NPV are not.
NPV = Cash flow / (1 + i)^t – initial investment
where:
i=Required return or discount rate
t=Number of time periods
12. Cost Volume Profit Analysis (CVP) (Management Analysis Techniques)
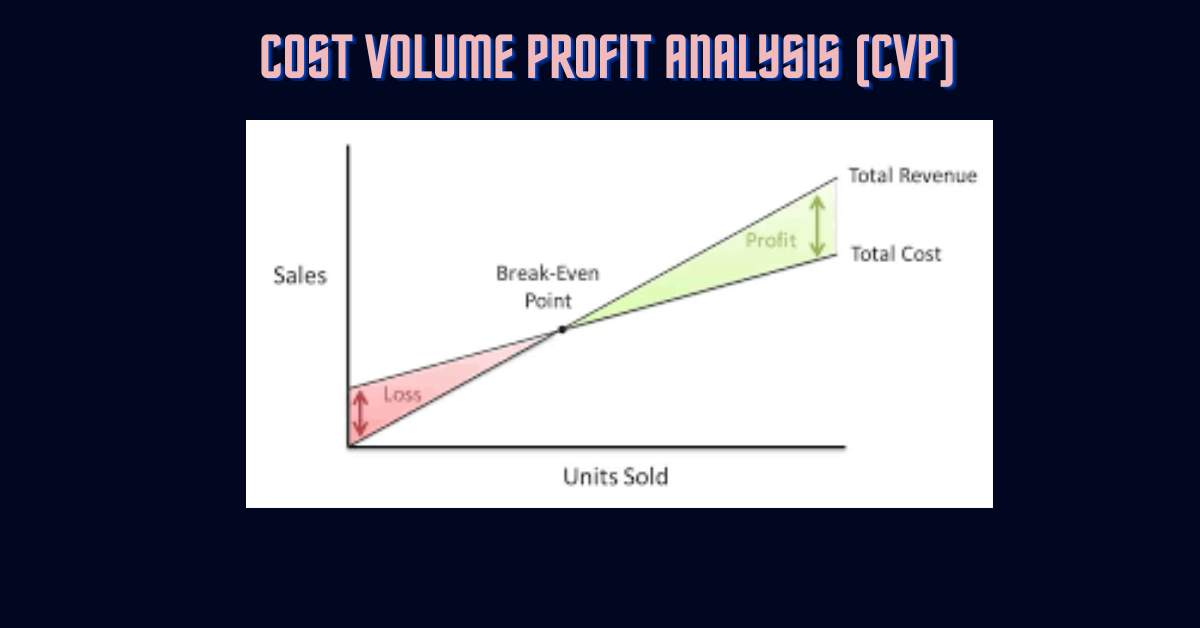
A financial management tool used to analyze the relationship between your firm’s sales volume, costs, and profits. Cost-volume-profit (CVP) analysis refers that it is a method of cost accounting that looks at the impact that varying levels of costs and volume have on operating profit.
CVP analysis helps a firm improve decision-making as it can give the firm an in-depth insight into how its costs affect its profits. The CVP can provide an understanding of what the firm’s price should be and if it needs to reduce costs to stay within a reasonable price range for the market.
The important CVP formula is as follows:
Profit = revenue – costs.
Of course, to be able to apply this formula, you require to know how to determine your revenue: (retail price x number of units). Additionally, you require to know how to calculate your costs: fixed costs + (unit variable cost x number of units).
13. Payback Period
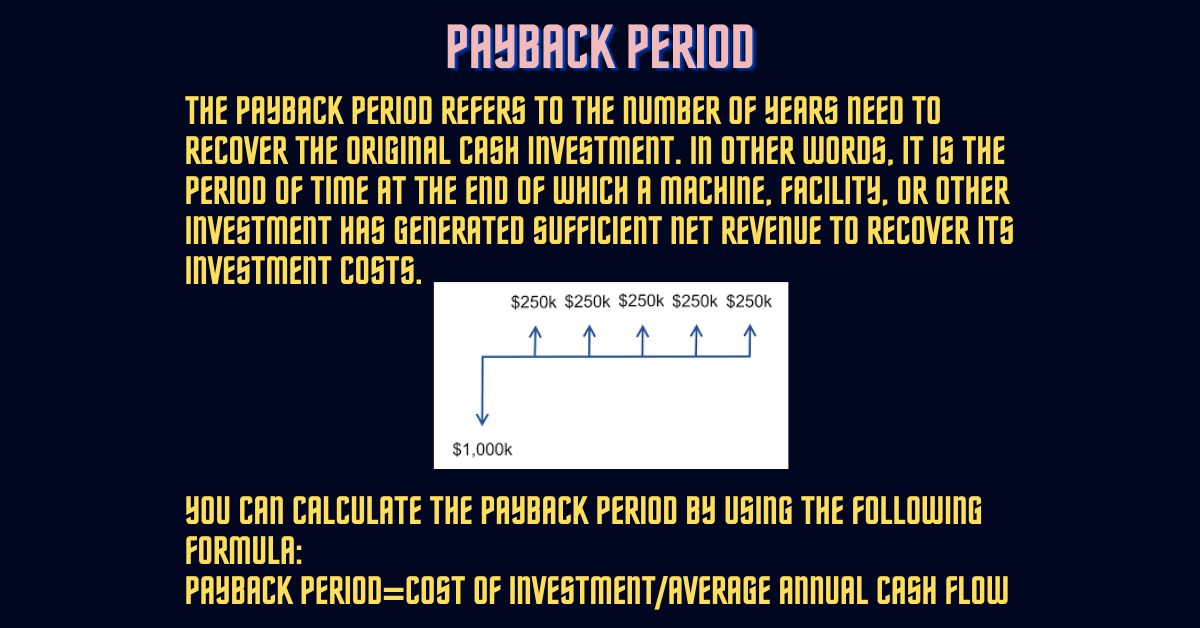
The payback period refers to the number of years need to recover the original cash investment. In other words, it is the period of time at the end of which a machine, facility, or other investment has generated sufficient net revenue to recover its investment costs.
It is a tool commonly used by investors, financial professionals, and corporations to determine investment returns. It assists determine how long it takes to recover the initial costs linked with an investment. This method is useful before making any decisions, especially when an investor requires to make a snap decision about an investment venture.
You can calculate the payback period by using the following formula:
Payback Period=Cost of Investment/Average Annual Cash Flow
14. Internal Rate of Return (IRR)
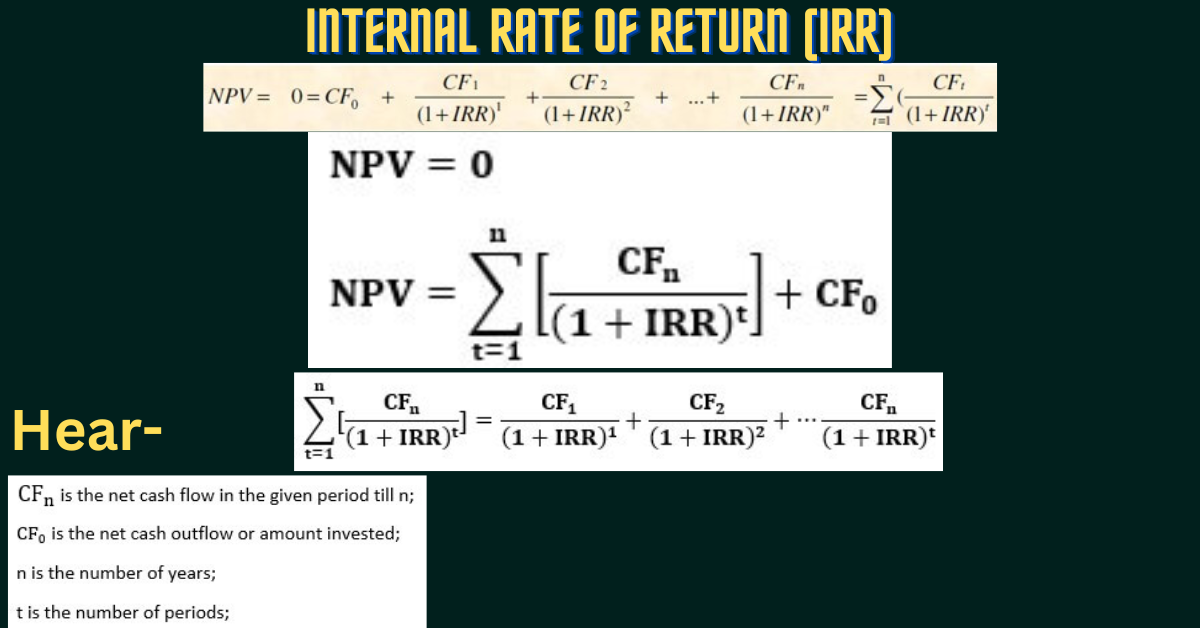
The internal rate of return (IRR) is a tool used in financial analysis to determine the profitability of potential investments.
Internal rate of return (IRR) is the discount rate at which a project’s returns or net present value become equal to its initial investment. In other words, it achieves a break-even point where the total cash inflows completely meet the total cash outflow
15. Cash Conversion Cycle (CCC)
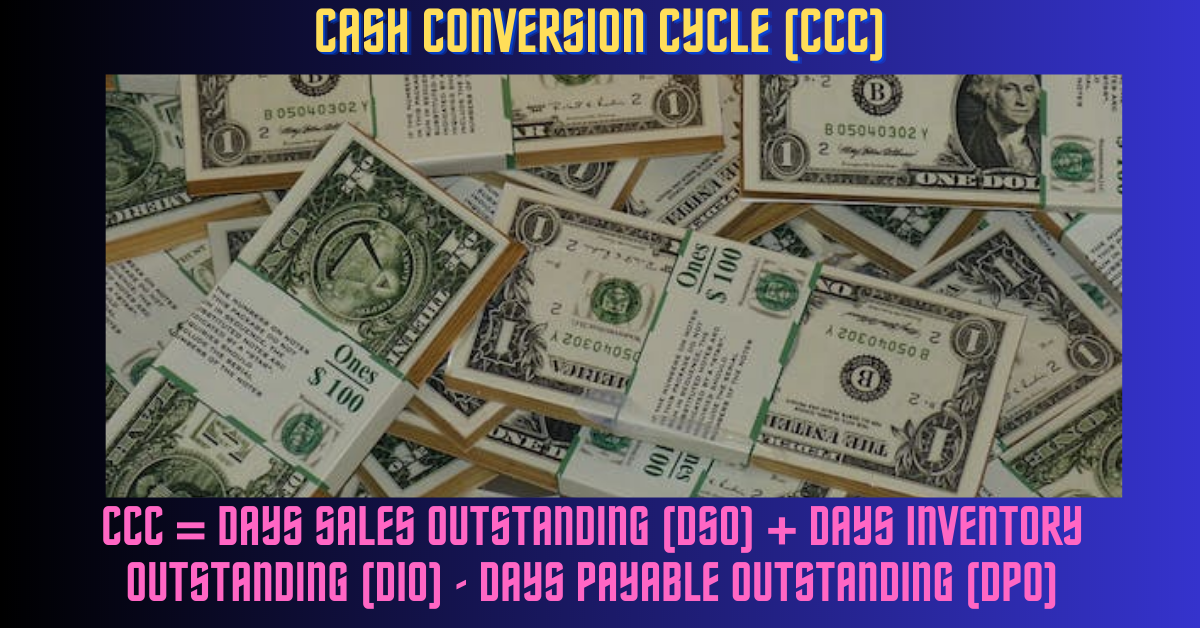
It is a financial tool that measures the time it takes for your firm to convert its investments in inventory and AR into cash.
There are various ways in which the CCC can be reduced. Some of them include the following:
- Facilitating early payments
- Reducing products Delivery time
- Implementing different modes of payment
- Simplifying the invoices process
- Investing in real-time analytics tools for proper tracking
Formula–Cash Conversion Cycle (CCC) = DSO (Days Sales Outstanding)+ Days Inventory Outstanding (DIO) – DPO (Days Payable Outstanding) or
CCC= DSO-DIO-DPO
16. Return on Assets (Management Analysis Techniques)

Return on assets is a technique that shows a company’s earnings in relation to its total assets. ROA can be used by management, analysts, and investors to calculate whether a company uses its assets efficiently to produce a profit. You can determine a company’s ROA by dividing its net income by its total assets.
ROA = (Net Income / Average Total Assets) x 100
17. Debt Service Coverage Ratio (Management Analysis Techniques)
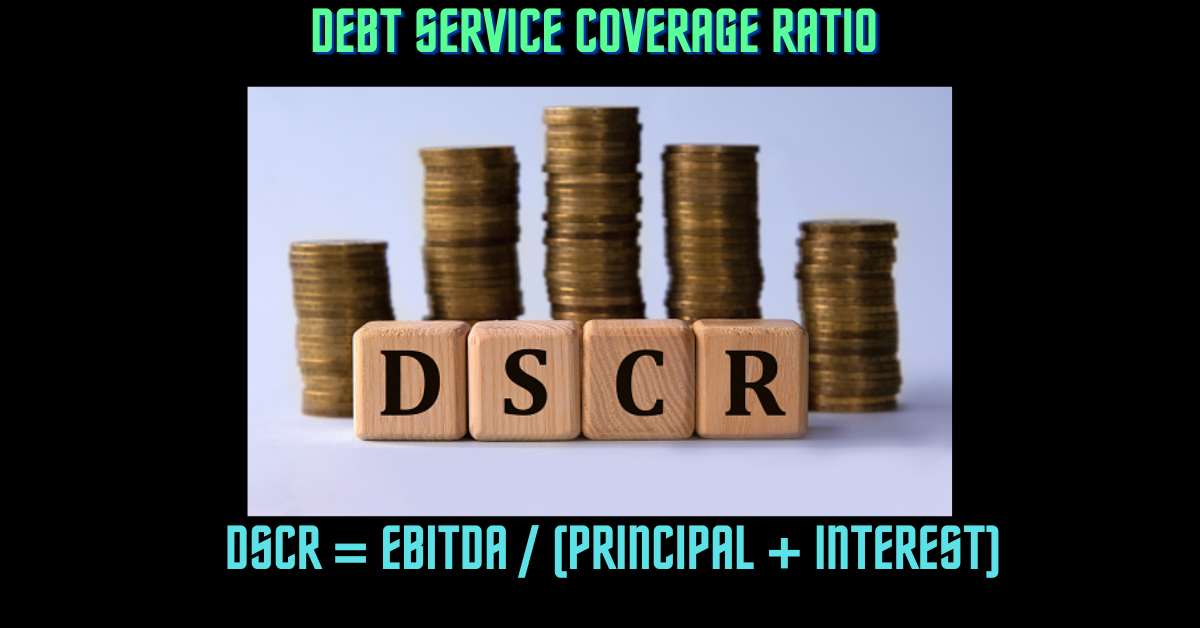
This is a measurement of a company’s available cash flow to pay current debt obligations. The DSCR reflects on investors whether a company has enough profit to pay its debts.
An indicator of your firm’s ability to meet its fixed debt payment obligations of principal and interest.
Formula-DSCR = EBITDA / (Principal + Interest)
18. Return on Invested Capital (Management Analysis Techniques)

It is a financial metric that measures your company’s ability to produce returns on the capital invested in the business.
Return on invested capital (ROIC) is a measurement used to determine how efficiently a company allocates its capital to profitable projects or investments. To determine the return on invested capital (ROIC), you divide net operating profit after tax (NOPAT) by invested capital.
ROIC = [Net Operating Profit After Taxes (NOPAT)) / (Total Debt + Total Equity – Cash and Cash Equivalents)] x 100
19. Weighted Average Cost of Capital (WACC)
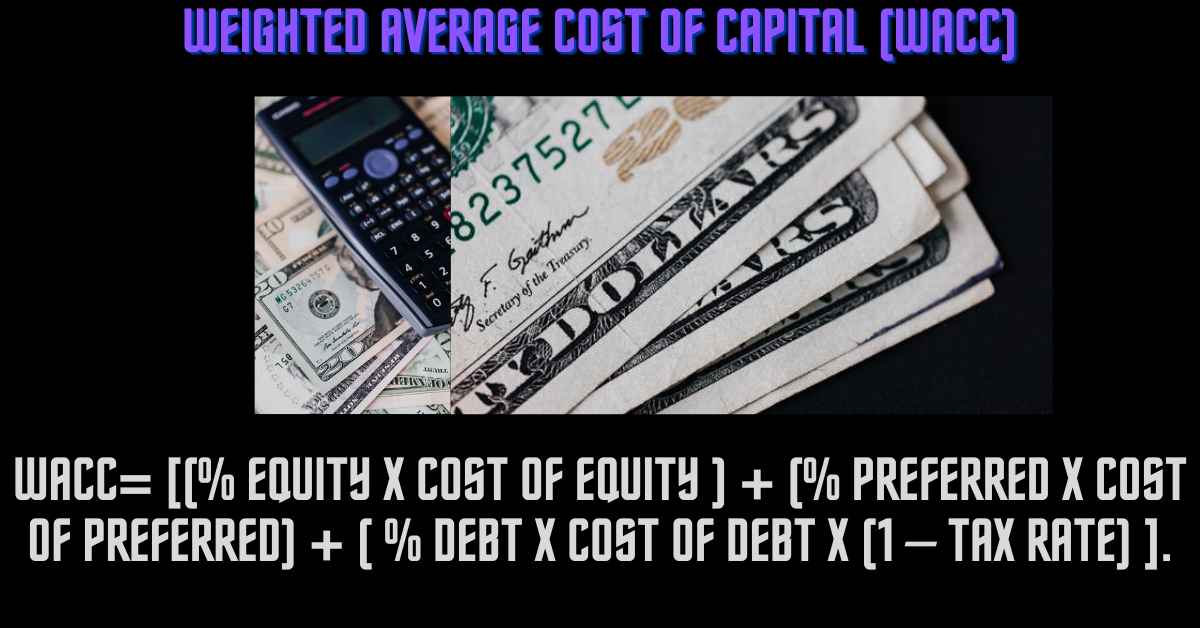
The weighted average cost of capital (WACC) shows a firm’s average after-tax cost of capital from all sources, including preferred stock, common stock, bonds, and other forms of debt. WACC is the average rate that a firm expects to pay to finance its assets.
Formula: WACC= [(% Equity x Cost of Equity ) + (% Preferred x Cost of Preferred) + ( % Debt x Cost of Debt x (1 – Tax Rate) ].
CAPM is used to determine the cost of equity which is used in the WACC formula.
20. Dividend Payout Ratio (Management Analysis Techniques)

The dividend payout ratio refers to the ratio of the total amount of dividends paid out to shareholders relative to the net income of the firm. It is the percentage of profits paid to shareholders in the form of dividends.
Or the dividend payout ratio refers to the relationship between the dividends paid by a firm and its net earnings across a defined period.
Formula:-Dividend Payout Ratio = (Dividends /Net Income)
=1−Retention Ratio
Retention Ratio=(EPS−DPS)/EPS
where:
EPS=Earnings per share
DPS=Dividends per share
Answer covered-People also ask
- 7 techniques of business analysis?
- 5 business analysis techniques?
- What are 5 of the analytical techniques a business person could use to analyze the current state of an organization?
- The different types of analysis in management?
Disclaimers
This article has been created on the basis of internal data, information available publicly, and other reliable sources to be believed. The article may also include information which are the personal views/opinions of the authors. The information includes in this article is for general, educational, and awareness purposes only and is not a full disclosure of every material fact.
All the information on this website – World Virtual CFO – is published in good faith and for general information purposes only. World Virtual CFO does not make any warranties about the completeness, reliability, and accuracy of this information. These are my views for only information purposes. Any action you take upon the information you find on this website (World Virtual CFO), is strictly at your own risk. World Virtual CFO will not be liable for any losses and/or damages in connection with using our website. For details please refer to our disclaimer page.
Dr. Dinesh Sharma is an award-winning CFO and AI strategist with over two decades of experience in financial leadership, digital transformation, and business optimization. As the founder of multiple niche platforms—including WorldVirtualCFO.com—he empowers professionals and organizations with strategic insights, system structuring, and innovative tools for sustainable growth. His blogs and e-books blend precision with vision, making complex financial and technological concepts accessible and actionable.